Quality assessment Report
Last Updated:
Find patient experience scores and performance on nearly 600 nationally recognized quality indicators and practices for Norton Healthcare hospitals. Where available, performance also is displayed for the average hospital in Kentucky and in the United States.
Norton Healthcare Quality Report
The following data represents only a portion of what there is to know about the quality of a hospital. The statistics and descriptions in this report are intended to be one of many factors patients may use to make an informed decision on where to receive care.
Quality Report Principles
- We do not decide what data to make public based on our rankings; we show good and bad results equally.
- When we have a nationally endorsed list of indicators, we display every indicator on the list.
- We display our results even when we disagree with the indicator definition
- We do not modify indicator definitions or inclusion/exclusion criteria in any way. Often indicator definitions have exclusions that are specific to Medicare patients or other clinical factors. This means that the measures do not always include the entire patient population that is treated within the organization, just a measurable sub segment (such as Medicare patients).
Using the Quality Report
About the Quality Reports
The report displays Norton Healthcare hospitals’ clinical results (such as complication rates or number of procedures performed) and patient experience results. Our financial report is in a separate section.
Data. We display two types of data:
- Measures, called “indicators,” such as the percentage of patients who had a complication
- Descriptions of our progress toward nationally recommended safe practices, such as the proper storage and administration of medications
Ratings:We rate our performance as explained below:
- Indicators that are percentages or ratios. . If national data are available for an indicator, we compare our performance with the national average and color code our results: green if we are better than the national average, red if we are worse than the national average and yellow if we are near the national average. We use standard statistical procedures to determine when to apply the color-coding, as described in Technical Notes. (Note: The hospital data in a particular row are compared with the U.S. average in that row. A percentage in one row cannot be valid compared with a percentage in a different row.)
- Indicators that are number of procedures performed. Some national organizations recommend a minimum annual number of cases for certain high-risk procedures. If we meet the minimum, we color our results green. If we do not, we color our results red.
- Safe practices. We give a subjective self-assessment of our progress and color our current status as follows: red (still in the planning stage), yellow (making progress) or green (in full compliance with the recommended practices).
Pop-Ups. Throughout the report, links and pop-up boxes may be activated by clicking with your mouse. For example, you can click on an indicator description or number, and a temporary box will open that provides additional explanation.
Without clicking on the data and ratings for additional details, you will see an incomplete picture of our performance.
National organizations have endorsed lists of quality indicators and safe practices. We address every hospital item on each endorsed list. All the indicators or safe practices have extensive research to support their use and are defined so that all hospitals can use the same method for calculating statistics.
Reporting methods are “open,” which means anyone can see how the results were obtained. The details of the organizations and their endorsed lists are in Technical Notes.
Indicators and safe practices are not perfect. We do not agree that all the items we are reporting are valid assessments of important quality issues. Even for such items, however, we use the national definition and report our performance. This full reporting is our assurance to you that we are not selectively reporting only our strengths. Further discussion of the limitations of indicators is in Technical Notes.
No. We are publishing hospital and physician group data only.
Generally not. Most of the clinical and patient experience information displayed here is not currently publicized by other hospitals. Data for these indicators can be found at Hospital Compare. Norton Healthcare also voluntarily posts the limited data requested on that site, but the information we’re displaying in this report is more comprehensive and current.
The Kentucky Hospital Association has begun to publish data about the charges and quality of Kentucky hospitals. Norton Healthcare is a strong supporter of this increasing “transparency” about hospital performance.
Technical notes: Norton Healthcare hospitals are combined by a single identification number for Medicare, therefore, data displayed by Hospital Compare is reflected as a single statistic labeled “Norton Hospitals Inc.” Statistics on that site refer to all patients at all Norton Healthcare hospitals.
External hospital quality websites will sometimes list some or all of our individual hospitals but will show the data for all our hospitals under “Norton Hospital” — for example, cardiac surgery performed at Norton Audubon Hospital may not be listed under that hospital’s name. The data in those reports typically include Medicare patients only.
Average indicator performance for hospitals in Kentucky (KY) and for the nation (U.S.) is displayed, if available. Those averages do not represent the performance of any individual hospital.
Open reporting helps you. As a not-for-profit health care system and a community resource, we believe that you should know how we are performing. We want patients and families to have better information about the quality of health care in Louisville.
Open reporting helps us. We have found that public reporting has helped us document our care more carefully, obtain more valid data and give better patient care than we would have without public reporting.
Open reporting helps hospital care in general. We hope that our quality report will contribute to a better understanding of how to assess, report and improve hospital quality. We often receive inquiries from other hospitals who are interested in our approach to quality reporting and who also want to provide better information to consumers. We welcome the chance to collaborate on better methods for making hospital quality data public.
The risk of a complication or death varies by patient and by procedure. For example, an older surgical patient who has complicating illnesses, such as kidney failure and diabetes, is at greater risk of developing complications than a young, healthy patient. Open heart surgery has a greater risk of a collapsed lung than knee surgery does.
Risk adjustment mathematically takes into account differences in patient and procedure risk factors, so that comparisons are more meaningful. Risk adjustment allows for comparison of actual performance with predicted performance based on the average U.S. hospital. More details of risk adjustment are explained in Technical Notes and on the websites of the national organizations that endorsed these indicators.
It’s not that simple. There are many possible reasons why performance on an indicator might be red. Here are a few:
- The hospital may provide care that is worse than the national average.
- About half the hospitals in the U.S. will be worse than average on any given indicator. No one wants to be worse than average, but even performance that is significantly worse than the national average may still be well within the range of good care.
- The hospital may do a better job than other hospitals of detecting and reporting infections or complications.
- The hospital may do a worse job than other hospitals of detecting and reporting risk factors, so the hospital is not getting full credit for the complexity of its cases.
- The indicator may do a poor job of capturing what it’s trying to measure.
- Indicators that are especially likely to be weak in this regard include those based only on number of procedures and those based on billing data (the AHRQ Patient Safety Indicators and Inpatient Quality Indicators use billing data).
- The indicator’s risk adjustment statistical model may not take into account all the factors that it should, so the hospital is not getting full credit for the complexity of its cases.
For additional information, see Technical Notes, especially the section on limitations of indicators.
This report is updated at least monthly as new data become available.
How to Use This Quality Report
To see the various parts of the quality report, click on the dropdown list such as Cancer or Heart Attack at the top of the page.
Measures have details available in the link “Learn more about the specific indicators shown on this page.” This can be found under “More Information” on every page. For additional information, click on the link. If you do not see additional information, it may not be available at this time or you may have a pop-up blocker enabled on your browser. Below you can see an example of contents presented on the “Childbirth” page, with the page header and key.
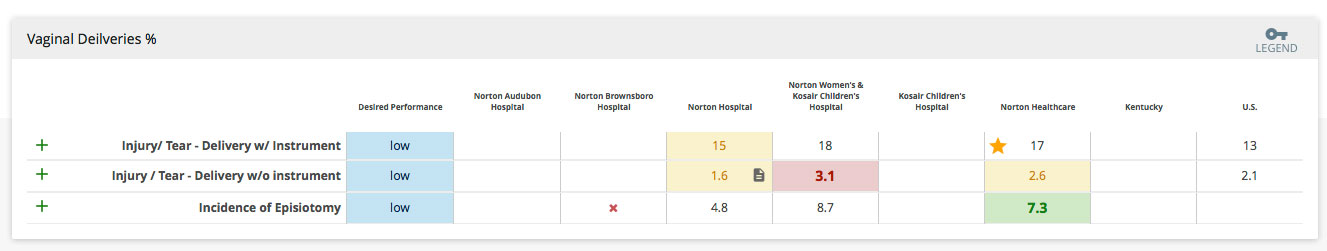
Brief description gives a phrase to identify the indicator. Clicking on the "Learn More" link at the bottom of the page will give a more detailed description that explains any abbreviations and gives some of the technical details of the indicator.
Desired performance indicates whether low or high numbers reflect better performance on the indicator.
Color-coding assists in analyzing results, which are colored as RED (worse than the national average), YELLOW (near the national average) or GREEN (better than the national average). If comparative data are unavailable or cannot be analyzed for technical reasons, statistics will be italicized and displayed in a white box. For some quality indicators it is unclear whether low or high performance is desirable. In such cases we color the results with orange or blue instead of red or green.
We show a *0* or *100* if a hospital has the best score possible, depending on the desired direction.
Patient Satisfaction Q & A
Norton Healthcare is committed to providing the highest quality of care possible to our patients. Listening to our patients’ feedback is our most valuable way to know what we are doing well — and to help us identify areas where we may have opportunities for improvement.
Norton Healthcare uses Press Ganey Associates to conduct a random sampling of our patients after their hospital stay/visit. Press Ganey is the health care industry’s leading independent vendor of experience measurement and improvement services. Press Ganey provides us results for our inpatient care, emergency department care, outpatient surgery care and outpatient tests/treatment. Our results are then benchmarked against other hospitals in the Press Ganey database.
Norton Audubon Hospital, Norton Hospital and Norton Women’s & Children’s Hospital are compared with other hospitals in Press Ganey’s large hospitals database (945 hospitals). Norton Children’s Hospital is compared with facilities in the pediatric database (52 facilities). Our hospital-specific scores — displayed here as a mean score for each service — allow us to gauge our current performance and then track improvement over time.
The surveys, using a 1-to-5 scale, ask patients to rate their experience with such areas as the admission/registration process, facilities, food, interactions with nurses and physicians, discharge process, personal issues, overall assessment of the care provided and other services. Patients choose a rating of very good, good, fair, poor and very poor. The ratings are converted to a score (very good = 100, good = 75, fair = 50, poor = 25, very poor = 0). The scores for all the questions are combined to calculate an average overall score for each patient. These overall scores are then combined to create a mean (average) score for each service at each hospital.
Norton Healthcare is one of the few health care organizations nationally to post its patient experience scores online. We view this as a natural next step for our organization to be both transparent and accountable to the community we serve, much as we already are with the posting of our clinical quality/patient safety and financial results. Given the great importance our organization places on improving the patient experience at our hospitals, we believe it is very important to share our results with those we serve.
Each hospital’s results for each service category are compared with the national average, with performance rated as green (better than U.S. average), yellow (near the U.S. average) and red (worse than the U.S. average). Like the rest of the interactive quality report, pop-up boxes provide more information about patient experience indicators, why they’re important, how the results were compiled, plans for improvement and other details.
We care about your comments. Let us know your thoughts and whether you would like to be contacted. We have established an online comments form available on our website. We will send your comments to the appropriate administrative office for review and consideration.
We have a dedicated email address that is answered by our quality report team. Any questions related to a specific indicator or score can be sent to quality@nortonhealthcare.org.
Quality Indicator Reference
| Item # | Our Brief Description | Our Category | Our Code |
|---|---|---|---|
| 1 | % heart attack patients given aspirin at arrival | heart attack | ami1 |
| 2 | % heart attack patients given aspirin at discharge | heart attack | ami2 |
| 3 | % heart attack patients given beta blocker at arrival | heart attack | ami6 |
| 4 | % heart attack patients given beta blocker at discharge | heart attack | ami5 |
| 5 | % heart attack patients who die (The Joint Commission risk-adjusted) | heart attack | ami9 |
| 6 | % heart attack patients with LVSD given ACEI or ARB | heart attack | ami3 |
| 7 | % heart attack / PCI patients treated w/in 120 minutes | heart attack | ami8a |
| 8 | % heart attack patients given thrombolytic w/in 30 min | heart attack | ami7a |
| 9 | # percutaneous coronary interventions (PCIs; AHRQ) | cardiovascular procedures | iqi06 |
| 10 | % PCI inpatients who die (risk-adjusted) | cardiovascular procedures | iqi30 |
| 11 | % heart bypass surgeries using internal mammary artery | cardiovascular procedures | crds06 |
| 12 | # heart bypass (only) surgical procedures per year | cardiovascular procedures | crds02a |
| 12 | # coronary artery bypass grafts (CABGs; AHRQ defn.) | cardiovascular procedures | iqi05 |
| 13 | % heart bypass patients with inpatient death | cardiovascular procedures | crds16 |
| 13 | % heart bypass patients with operative death (adj) | cardiovascular procedures | crds17 |
| 13 | % heart bypass patients who die (AHRQ risk-adj.) | cardiovascular procedures | iqi12 |
| 14 | % heart failure inpatients with LVF assessment | heart failure | hf2 |
| 15 | % heart failure inpatients given discharge instructions | heart failure | hf1 |
| 16 | % heart failure inpats prescribed ACEI/ARB at discharge | heart failure | hf3 |
| 17 | /1,000 cath-days, cath-assoc. UTIs, Pediatric ICU pats. | children | ic01c |
| 17 | /1,000 cath-days, cath-assoc. UTIs, Med-Surg ICU pats. | infection control | ic01a |
| 17 | /1,000 cath-days, cath-assoc. UTIs, Card-Thor ICU pats. | infection control | ic01b |
| 18 | /1,000 line-days, cath-assoc. BSIs, Pediatric ICU pats. | children | ic02c |
| 18 | /1000 line-days, cath-assoc. BSIs, NICU pats. <=750 g | children | ic02d0 |
| 18 | /1000 line-days, cath-assoc. BSIs, NICU pats. 751-1000 g | children | ic02d1 |
| 18 | /1000 line-days, cath-assoc BSI, NICU pats. 1001-1500 g | children | ic02e |
| 18 | /1000 line-days, cath-assoc BSI, NICU pats. 1501-2500 g | children | ic02f |
| 18 | /1000 line-days, cath-assoc. BSIs, NICU pats. 2500+ g | children | ic02g |
| 18 | /1,000 line-days, cath-assoc. BSIs, Med-Surg ICU pats. | infection control | ic02a |
| 18 | /1,000 line-days, cath-assoc. BSIs, Card-Thor ICU pats. | infection control | ic02b |
| 19 | /1000 vent-days, vent-assoc. pneum, Pediatric ICU pats. | children | ic03c |
| 19 | /1000 vent-days, vent-assoc. pneum, NICU pats. <=750 g | children | ic03d0 |
| 19 | /1000 vent-days, vent-assoc. pneum, NICU pats. 751-1000 g | children | ic03d1 |
| 19 | /1000 vent-days, vent-assc pneum, NICU pts. 1001-1500 g | children | ic03e |
| 19 | /1000 vent-days, vent-assc pneum, NICU pts. 1501-2500 g | children | ic03f |
| 19 | /1000 vent-days, vent-assoc. pneum, NICU pats. 2500+ g | children | ic03g |
| 19 | /1,000 vent-days, vent-assoc. pneum, Med-Surg ICU pats. | infection control | ic03a |
| 19 | /1,000 vent-days, vent-assoc. pneum, Card-Thor ICU pts. | infection control | ic03b |
| 20 | /1,000 inpt. days, patient falls, Critical Care areas | patient safety | nsi03a |
| 20 | /1,000 inpt. days, patient falls, Step Down areas | patient safety | nsi03b |
| 20 | /1,000 inpt. days, patient falls, Med-Surg areas | patient safety | nsi03c |
| 21 | % pediatric asthma inpatients given relievers, age 0-17 | children | ped1 |
| 21 | % pediatric asthma inpatients given relievers, age 0-2 | children | ped1a |
| 21 | % pediatric asthma inpatients given relievers, age 3-5 | children | ped1b |
| 21 | % pediatric asthma inpatients given relievers, age 6-17 | children | ped1c |
| 22 | % ped asthma inpts. given systemic c'steroids, age 0-17 | children | ped2 |
| 22 | % ped asthma inpts. given systemic c'steroids, age 0-2 | children | ped2a |
| 22 | % ped asthma inpts. given systemic c'steroids, age 3-5 | children | ped2b |
| 22 | % ped asthma inpts. given systemic c'steroids, age 6-17 | children | ped2c |
| 23 | % neonatal inpatients given neonatal immunization | children | ped3 |
| 24 | % pneumonia inpatients given an oxygenation assessment | pneumonia | pn1 |
| 25 | % pneumonia inpatients given recommended antibiotic | pneumonia | pn6 |
| 26 | % pneumonia inpat ED blood cultures before 1st antibiotic | pneumonia | pn3b |
| 27 | % pneumonia inpts screened or vaccinated for influenza | pneumonia | pn7 |
| 28 | % pneumonia inpatients given pneumococcal vaccination | pneumonia | pn2 |
| 29 | % pneumonia inpts given antibiotic w/in 4hrs of arrival | pneumonia | pn5b |
| 30 | % deliveries, vaginal birth after cesarean - uncomplic. | childbirth | iqi22 |
| 30 | % deliveries, vaginal birth after cesarean - all | childbirth | iqi34 |
| 31 | Area rate: Postop hemorrhage or hematoma | area rate | psi27 |
| 32 | % neonate inpts who die w/in 28 days of birth; risk-adj | childbirth | pr2 |
| 33 | % deliveries that are the mother's first C-section | childbirth | iqi33 |
| 34 | % heart attack smoking pats. given smoking counseling | heart attack | ami4 |
| 35 | % heart failure smoking pats. given smoking counseling | heart failure | hf4 |
| 36 | % pneumonia inpatients given smoking counseling | pneumonia | pn4 |
| 37 | % select surg. patients given preop. antibiotic on time | surgery | sip1 |
| 38 | % select surg. patients given recom. preop. antibiotic | surgery | sip2 |
| 39 | % select surg. pats. w/antibiotic discontinued on time | surgery | sip3 |
| 40 | heart attack pts who die of any cause w/in 30 days | heart attack | amimort |
| 41 | heart failure pts who die of any cause w/in 30 days | heart failure | hfmort |
| Item # | Our Brief Description | Our Category | Our Code |
|---|---|---|---|
| 1 | % w/ select complications who die - surgical inpatients | patient safety | psi04b |
| 2 | % inpatients with pressure ulcer Critical Care areas | patient safety | nsi06a |
| 2 | % inpatients with pressure ulcer Step Down areas | patient safety | nsi06b |
| 2 | % inpatients with pressure ulcer Med-Surg areas | patient safety | nsi06c |
| 2 | % inpatients with pressure ulcer Medical areas | patient safety | nsi06d |
| 2 | % inpatients with pressure ulcer Surgical areas | patient safety | nsi06e |
| 3 | /1,000 inpt. days, patient falls, Critical Care areas | patient safety | nsi03a |
| 3 | /1,000 inpt. days, patient falls, Step Down areas | patient safety | nsi03b |
| 3 | /1,000 inpt. days, patient falls, Med-Surg areas | patient safety | nsi03c |
| 3 | /1,000 inpt. days, patient falls, Medical areas | patient safety | nsi03d |
| 3 | /1,000 inpt. days, patient falls, Surgical areas | patient safety | nsi03e |
| 3 | /1,000 inpt days, falls w/ injury, Critical Care areas | patient safety | nsi04a |
| 3 | /1,000 inpt days, falls w/ injury, Step Down areas | patient safety | nsi04b |
| 3 | /1,000 inpt days, falls w/ injury, Med-Surg areas | patient safety | nsi04c |
| 3 | /1,000 inpt days, falls w/ injury, Medical areas | patient safety | nsi04d |
| 3 | /1,000 inpt days, falls w/ injury, Surgical areas | patient safety | nsi04e |
| 4 | % inpatients with restraint use, Critical Care areas | patient safety | nsi05a |
| 4 | % inpatients with restraint use, Step Down areas | patient safety | nsi05b |
| 4 | % inpatients with restraint use, Med-Surg areas | patient safety | nsi05c |
| 5 | % direct pat. care hours by contract (skill mix) - ICU | nursing care | nsi12a |
| 5 | % direct pat. care hours by LPN (skill mix) - ICU | nursing care | nsi12b |
| 5 | % direct pat. care hours by RN (skill mix) - ICU | nursing care | nsi12c |
| 5 | % direct pat. care hours by UAP (skill mix) - ICU | nursing care | nsi12d |
| 5 | % dir. pat care hours by contr. (skill mix) - StepDown | nursing care | nsi12e |
| 5 | % direct pat. care hours by LPN (skill mix) - StepDown | nursing care | nsi12f |
| 5 | % direct pat. care hours by RN (skill mix) - StepDown | nursing care | nsi12g |
| 5 | % direct pat. care hours by UAP (skill mix) - StepDown | nursing care | nsi12h |
| 5 | % dir. pat. care hours by contr. (skill mix) - Med-Surg | nursing care | nsi12i |
| 5 | % direct pat. care hours by LPN (skill mix) - Med-Surg | nursing care | nsi12j |
| 5 | % direct pat. care hours by RN (skill mix) - Med-Surg | nursing care | nsi12k |
| 5 | % direct pat. care hours by UAP (skill mix) - Med-Surg | nursing care | nsi12l |
| 5 | % dir. pat. care hours by contr. (skill mix) - Medical | nursing care | nsi12m |
| 5 | % direct pat. care hours by LPN (skill mix) - Medical | nursing care | nsi12n |
| 5 | % direct pat. care hours by RN (skill mix) - Medical | nursing care | nsi12o |
| 5 | % direct pat. care hours by UAP (skill mix) - Medical | nursing care | nsi12p |
| 5 | % dir. pat. care hours by contr. (skill mix) - Surgical | nursing care | nsi12q |
| 5 | % direct pat. care hours by LPN (skill mix) - Surgical | nursing care | nsi12r |
| 5 | % direct pat. care hours by RN (skill mix) - Surgical | nursing care | nsi12s |
| 5 | % direct pat. care hours by UAP (skill mix) - Surgical | nursing care | nsi12t |
| 5 | % dir pat care hours by contr. (skill mix) - Neonate ICU | nursing care | nsi12u |
| 5 | % direct pat. care hours by RN (skill mix) - Neonate ICU | nursing care | nsi12v |
| 5 | % direct pat care hours by LPN (skill mix) - Neonate ICU | nursing care | nsi12w |
| 5 | % direct pat care hours by UAP (skill mix) - Neonate ICU | nursing care | nsi12x |
| 6 | /1,000 cath-days, cath-assoc. UTIs, Pediatric ICU pats. | children infection control | ic01c |
| 6 | /1,000 cath-days, cath-assoc. UTIs, Med-Surg ICU pats. | infection control | ic01a |
| 6 | /1,000 cath-days, cath-assoc. UTIs, Card-Thor ICU pats. | infection control | ic01b |
| 6 | ratio RN direct pat. care hours per patient day - ICU | nursing care | nsi13a |
| 6 | ratio total dir. pat. care hours per patient day - ICU | nursing care | nsi13b |
| 6 | ratio RN dir. pat. care hrs. per patient day - StepDown | nursing care | nsi13c |
| 6 | ratio total dir pat care hrs per patient day - StepDown | nursing care | nsi13d |
| 6 | ratio RN dir pat. care hours per patient day - Med-Surg | nursing care | nsi13e |
| 6 | ratio total dir pat care hrs per patient day - Med-Surg | nursing care | nsi13f |
| 6 | ratio RN dir pat care hours per patient day - Medical | nursing care | nsi13g |
| 6 | ratio total dir pat care hrs per patient day - Medical | nursing care | nsi13h |
| 6 | ratio RN dir pat care hours per patient day - Surgical | nursing care | nsi13i |
| 6 | ratio total dir pat care hrs per patient day - Surgical | nursing care | nsi13j |
| 6 | ratio RN dir pat care hours per patient day-Neonate ICU | nursing care | nsi13k |
| 6 | ratio total dir pat care hrs per patient day-Neonate ICU | nursing care | nsi13l |
| 7 | /1,000 line-days, cath-assoc. BSIs, Pediatric ICU pats. | children | ic02c |
| 7 | /1000 line-days, cath-assoc. BSIs, NICU pats. <=1000 g | children | ic02d |
| 7 | /1000 line-days, cath-assoc BSI, NICU pats. 1001-1500 g | children | ic02e |
| 7 | /1000 line-days, cath-assoc BSI, NICU pats. 1501-2500 g | children | ic02f |
| 7 | /1000 line-days, cath-assoc. BSIs, NICU pats. 2500+ g | children | ic02g |
| 7 | /1,000 line-days, cath-assoc. BSIs, Med-Surg ICU pats. | infection control | ic02a |
| 7 | /1,000 line-days, cath-assoc. BSIs, Card-Thor ICU pats. | infection control | ic02b |
| 7 | avg. nurse answer 1-4 survey, all questions | nursing care | nsi14 |
| 7 | avg. nurse answer 1-4 survey, participation subscale | nursing care | nsi14a |
| 7 | avg. nurse answer 1-4 survey, foundations subscale | nursing care | nsi14b |
| 7 | avg. nurse answer 1-4 survey, leadership subscale | nursing care | nsi14c |
| 7 | avg. nurse answer 1-4 survey, staffing subscale | nursing care | nsi14d |
| 7 | avg. nurse answer 1-4 survey, MD collaboration subscale | nursing care | nsi14e |
| 8 | /1000 vent-days, vent-assoc. pneum, Pediatric ICU pats. | children | ic03c |
| 8 | /1000 vent-days, vent-assoc. pneum, NICU pats. <=1000 g | children | ic03d |
| 8 | /1000 vent-days, vent-assc pneum, NICU pts. 1001-1500 g | children | ic03e |
| 8 | /1000 vent-days, vent-assc pneum, NICU pts. 1501-2500 g | children | ic03f |
| 8 | /1000 vent-days, vent-assoc. pneum, NICU pats. 2500+ g | children | ic03g |
| 8 | /1,000 vent-days, vent-assoc. pneum, Med-Surg ICU pats. | infection control | ic03a |
| 8 | /1,000 vent-days, vent-assoc. pneum, Card-Thor ICU pts. | infection control | ic03b |
| 8 | % nursing staff who choose to leave each year - RN | nursing care | nsi15a |
| 8 | % nursing staff who choose to leave each year - LPN | nursing care | nsi15b |
| 8 | % nursing staff who choose to leave each year - UAP | nursing care | nsi15c |
| 9 | % heart attack smoking pats. given smoking counseling | heart attack | ami4 |
| 10 | % heart failure smoking pats. given smoking counseling | heart failure | hf4 |
| 11 | % pneumonia inpatients given smoking counseling | pneumonia | pn4 |
| Item # | Our Brief Description | Our Category | Our Code |
|---|---|---|---|
| 1 | % heart attack patients given aspirin at arrival | heart attack | ami1 |
| 2 | % heart attack patients given aspirin at discharge | heart attack | ami2 |
| 3 | % heart attack patients given beta blocker at arrival | heart attack | ami6 |
| 4 | % heart attack patients given beta blocker at discharge | heart attack | ami5 |
| 5 | % heart attack patients who die (The Joint Commission risk-adjusted) | heart attack | ami9 |
| 6 | % heart attack patients with LVSD given ACEI or ARB | heart attack | ami3 |
| 7 | % heart attack / PCI patients treated w/in 120 minutes | heart attack | ami8a |
| 8 | % heart attack patients given thrombolytic w/in 30 min | heart attack | ami7a |
| 9 | # percutaneous coronary interventions (PCIs; AHRQ) | heart procedures | iqi06 |
| 10 | % PCI inpatients who die (risk-adjusted) | heart procedures | iqi30 |
| 11 | % heart bypass surgeries using internal mammary artery | heart procedures | crds06 |
| 12 | # heart bypass (only) surgical procedures per year | heart procedures | crds02a |
| 12 | # coronary artery bypass grafts (CABGs; AHRQ defn.) | heart procedures | iqi05 |
| 13 | % heart bypass patients with inpatient death | heart procedures | crds16 |
| 13 | % heart bypass patients with operative death (adj) | heart procedures | crds17 |
| 13 | % heart bypass patients who die (AHRQ risk-adj.) | heart procedures | iqi12 |
| 14 | % heart failure inpatients with LVF assessment | heart failure | hf2 |
| 15 | % heart failure inpatients given discharge instructions | heart failure | hf1 |
| 16 | % heart failure inpats prescribed ACEI/ARB at discharge | heart failure | hf3 |
| 17 | /1,000 cath-days, cath-assoc. UTIs, Pediatric ICU pats. | children | ic01c |
| 17 | /1,000 cath-days, cath-assoc. UTIs, Med-Surg ICU pats. | infection control | ic01a |
| 17 | /1,000 cath-days, cath-assoc. UTIs, Card-Thor ICU pats. | infection control | ic01b |
| 18 | /1,000 line-days, cath-assoc. BSIs, Pediatric ICU pats. | children | ic02c |
| 18 | /1000 line-days, cath-assoc. BSIs, NICU pats. <=750 g | children | ic02d0 |
| 18 | /1000 line-days, cath-assoc. BSIs, NICU pats. 751-1000 g | children | ic02d1 |
| 18 | /1000 line-days, cath-assoc BSI, NICU pats. 1001-1500 g | children | ic02e |
| 18 | /1000 line-days, cath-assoc BSI, NICU pats. 1501-2500 g | children | ic02f |
| 18 | /1000 line-days, cath-assoc. BSIs, NICU pats. 2500+ g | children | ic02g |
| 18 | /1,000 line-days, cath-assoc. BSIs, Med-Surg ICU pats. | infection control | ic02a |
| 18 | /1,000 line-days, cath-assoc. BSIs, Card-Thor ICU pats. | infection control | ic02b |
| 19 | /1000 vent-days, vent-assoc. pneum, Pediatric ICU pats. | children | ic03c |
| 19 | /1000 vent-days, vent-assoc. pneum, NICU pats. <=750 g | children | ic03d0 |
| 19 | /1000 vent-days, vent-assoc. pneum, NICU pats. 751-1000 g | children | ic03d1 |
| 19 | /1000 vent-days, vent-assc pneum, NICU pts. 1001-1500 g | children | ic03e |
| 19 | /1000 vent-days, vent-assc pneum, NICU pts. 1501-2500 g | children | ic03f |
| 19 | /1000 vent-days, vent-assoc. pneum, NICU pats. 2500+ g | children | ic03g |
| 19 | /1,000 vent-days, vent-assoc. pneum, Med-Surg ICU pats. | infection control | ic03a |
| 19 | /1,000 vent-days, vent-assoc. pneum, Card-Thor ICU pts. | infection control | ic03b |
| 20 | /1,000 inpt. days, patient falls, Critical Care areas | patient safety | nsi03a |
| 20 | /1,000 inpt. days, patient falls, Step Down areas | patient safety | nsi03b |
| 20 | /1,000 inpt. days, patient falls, Med-Surg areas | patient safety | nsi03c |
| 21 | % pediatric asthma inpatients given relievers, age 0-17 | children | ped1 |
| 21 | % pediatric asthma inpatients given relievers, age 0-2 | children | ped1a |
| 21 | % pediatric asthma inpatients given relievers, age 3-5 | children | ped1b |
| 21 | % pediatric asthma inpatients given relievers, age 6-17 | children | ped1c |
| 22 | % ped asthma inpts. given systemic c'steroids, age 0-17 | children | ped2 |
| 22 | % ped asthma inpts. given systemic c'steroids, age 0-2 | children | ped2a |
| 22 | % ped asthma inpts. given systemic c'steroids, age 3-5 | children | ped2b |
| 22 | % ped asthma inpts. given systemic c'steroids, age 6-17 | children | ped2c |
| 23 | % neonatal inpatients given neonatal immunization | children | ped3 |
| 24 | % pneumonia inpatients given an oxygenation assessment | pneumonia | pn1 |
| 25 | % pneumonia inpatients given recommended antibiotic | pneumonia | pn6 |
| 26 | % pneumonia inpat ED blood cultures before 1st antibiotic | pneumonia | pn3b |
| 27 | % pneumonia inpts screened or vaccinated for influenza | pneumonia | pn7 |
| 28 | % pneumonia inpatients given pneumococcal vaccination | pneumonia | pn2 |
| 29 | % pneumonia inpts given antibiotic w/in 4hrs of arrival | pneumonia | pn5b |
| 30 | % deliveries, vaginal birth after cesarean - uncomplic. | childbirth | iqi22 |
| 30 | % deliveries, vaginal birth after cesarean - all | childbirth | iqi34 |
| 31 | Area rate: Postop hemorrhage or hematoma | area rate | psi27 |
| 32 | % neonate inpts who die w/in 28 days of birth; risk-adj | childbirth | pr2 |
| 33 | % deliveries that are the mother's first C-section | childbirth | iqi33 |
| 34 | % heart attack smoking pats. given smoking counseling | heart attack | ami4 |
| 35 | % heart failure smoking pats. given smoking counseling | heart failure | hf4 |
| 36 | % pneumonia inpatients given smoking counseling | pneumonia | pn4 |
| 37 | % select surg. patients given preop. antibiotic on time | surgery | sip1 |
| 38 | % select surg. patients given recom. preop. antibiotic | surgery | sip2 |
| 39 | % select surg. pats. w/antibiotic discontinued on time | surgery | sip3 |
| 40 | heart attack pts who die of any cause w/in 30 days | heart attack | amimort |
| 41 | heart failure pts who die of any cause w/in 30 days | heart failure | hfmort |
| Item # | Our Brief Description | Our Category | Our Code |
|---|---|---|---|
| 1 | Use at least two patient identifiers (neither to be the patient's room number... | safe practices | npsg1a |
| 2 | For verbal or telephone orders or for telephonic reporting of critical test r... | safe practices | npsg2a |
| 3 | Standardize a list of abbreviations, acronyms and symbols that are not to be... | safe practices | npsg2b |
| 4 | Measure, assess and, if appropriate, take action to improve the timeliness of... | safe practices | npsg2c |
| 5 | Implement a standardized approach to "hand off" communications, including an... | safe practices | npsg2e |
| 6 | Standardize and limit the number of drug concentrations available in the orga... | safe practices | npsg3b |
| 7 | Identify and, at a minimum, annually review a list of look-alike/sound-alike... | safe practices | npsg3c |
| 8 | Label all medications, medication containers (e.g., syringes, medicine cups,... | safe practices | npsg3d |
| 9 | Comply with current Centers for Disease Control and Prevention (CDC) hand hyg... | safe practices | npsg7a |
| 10 | Manage as sentinel events all identified cases of unanticipated death or majo... | safe practices | npsg7b |
| 11 | Implement a process for obtaining and documenting a complete list of the pati... | safe practices | npsg8a |
| 12 | A complete list of the patient's medications is communicated to the next prov... | safe practices | npsg8b |
| 13 | Implement a fall reduction program and evaluate the effectiveness of the prog... | safe practices | npsg9b |
| Item # | Our Brief Description | Our Category | Our Code |
|---|---|---|---|
| 14 | Prior to the start of any invasive procedure, conduct a final verification pr... | safe practices | unip1 |
| 15 | Create and use a preoperative verification process, such as a checklist, to c... | safe practices | unip2 |
| 16 | Implement a process to mark the surgical site and involve the patient in the... | safe practices | unip3 |
| Item # | Our Brief Description | Our Category | Our Code |
|---|---|---|---|
| Agency for Healthcare Research and Quality (AHRQ) Patient Safety Indicators (PSIs) | |||
| 1 | % inpatients with a reported complication of anesthesia | surgery | psi01 |
| 2 | % inpatients in low-mortality DRGs who die | patient safety | psi02 |
| 3 | % inpatients developing in-hosp pressure ulcer (AHRQ) | patient safety | psi03 |
| 4 | % w/ select complications who die ("failure to rescue") | patient safety | psi04 |
| 4 | % w/ select complications who die - surgical inpatients | patient safety | psi04b |
| 5 | % surgeries when foreign body was unintentionally left | surgery | psi05 |
| 6 | % w/ pneumothorax resulting from medical care | surgery | psi06 |
| 7 | % inpatients with possible infection due to IV lines | infection control | psi07 |
| 8 | % surgeries w/ a postoperative hip fracture | surgery | psi08 |
| 9 | % surgeries w/ postoperative bleeding | surgery | psi09 |
| 10 | % surgeries w/ postoperative physiologic derangement | surgery | psi10 |
| 11 | % surgeries w/ postoperative respiratory failure | surgery | psi11 |
| 12 | % surgeries w/ postoperative PE or DVT | surgery | psi12 |
| 13 | % surgeries w/ postoperative sepsis | surgery | psi13 |
| 14 | % abdominal surgeries w/ postop wound dehiscence | surgery | psi14 |
| 15 | % select surgeries encountering technical difficulties | surgery | psi15 |
| 16 | % inpatients w/ a blood transfusion reaction | patient safety | psi16 |
| 17 | % delivered newborns with birth trauma or injury | childbirth | psi17 |
| 18 | % vaginal deliveries w/ instrument -- injury/tear | childbirth | psi18 |
| 19 | % vaginal deliveries w/o instrument -- injury/tear | childbirth | psi19 |
| 20 | % cesarean deliveries -- injury/tear | childbirth | psi20 |
| 21 | Area rate: Foreign body left during procedure | area rate | psi21 |
| 22 | Area rate: Iatrogenic pneumothorax | area rate | psi22 |
| 23 | Area rate: Possible infection due to IV lines | area rate | psi23 |
| 24 | Area rate: Postop wound dehiscence | area rate | psi24 |
| 25 | Area rate: Select surgeries encountering technical difficulties | area rate | psi25 |
| 26 | Area rate: Transfusion reaction | area rate | psi26 |
| 27 | Area rate: Postop hemorrhage or hematoma | area rate | psi27 |
| Item # | Our Brief Description | Our Category | Our Code |
|---|---|---|---|
| 1 | # esophageal resection surgical procedures (AHRQ defn.) | surgery | iqi01 |
| 2 | # pancreatic resection surgical procedures (AHRQ defn.) | surgery | iqi02 |
| 4 | # abdominal aortic aneurysm repairs (AHRQ defn.) | cardiovascular procedures | iqi04 |
| 5 | # coronary artery bypass grafts (CABGs; AHRQ defn.) | cardiovascular procedures | iqi05 |
| 6 | # percutaneous coronary interventions (PCIs; AHRQ) | cardiovascular procedures | iqi06 |
| 7 | # carotid endarterectomy surgical proceds. (AHRQ defn.) | cardiovascular procedures | iqi07 |
| 8 | % esophageal resection patients who die (AHRQ risk-adj) | surgery | iqi08 |
| 9 | % pancreatic resection patients who die (AHRQ risk-adj) | surgery | iqi09 |
| 11 | % AAA repair patients who die (AHRQ risk-adj) | cardiovascular procedures | iqi11 |
| 12 | % heart bypass patients who die (AHRQ risk-adj.) | cardiovascular procedures | iqi12 |
| 13 | % craniotomy patients who die (AHRQ risk-adjusted) | surgery | iqi13 |
| 14 | % hip replacement patients who die (risk-adjusted) | surgery | iqi14 |
| 15 | % heart attack (AMI) patients who die (AHRQ risk-adj.) | heart attack | iqi15 |
| 16 | % heart failure inpatients who die (risk-adjusted) | heart failure | iqi16 |
| 17 | % acute stroke inpatients who die (risk-adjusted) | other | iqi17 |
| 18 | % GI hemorrhage inpatients who die (risk-adjusted) | other | iqi18 |
| 19 | % hip fracture inpatients who die (risk-adjusted) | other | iqi19 |
| 20 | % pneumonia inpatients who die (risk-adjusted) | pneumonia | iqi20 |
| 21 | % deliveries that are C-sections (primary+repeat) | childbirth | iqi21 |
| 22 | % deliveries, vaginal birth after cesarean - uncomplic. | childbirth | iqi22 |
| 23 | % gall bladder surgery done laparoscopically | surgery | iqi23 |
| 24 | % incidental appendectomy in those over 64 years old | surgery | iqi24 |
| 25 | % cardiac catheterizations that are bilateral | cardiovascular procedures | iqi25 |
| 30 | % PCI inpatients who die (risk-adjusted) | cardiovascular procedures | iqi30 |
| 31 | % carotid endarterectomy patients who die (risk-adj) | cardiovascular procedures | iqi31 |
| 32 | % nontransferred AMI inpatients who die (risk-adj) | heart attack | iqi32 |
| 33 | % deliveries that are the mother's first C-section | childbirth | iqi33 |
| 34 | % deliveries, vaginal birth after cesarean - all | childbirth | iqi34 |
| Item # | Our Brief Description | Our Category | Our Code |
|---|---|---|---|
| 1 | % select ped surgeries encountering technical difficulties | children | pdi01 |
| 2 | % ped inpats developing in-hosp pressure ulcer (AHRQ) | children | pdi02 |
| 3 | % ped surg when foreign body was unintentionally left | children | pdi03 |
| 4 | % neonates w/ pneumothorax resulting from medical care | children | pdi04 |
| 5 | % ped pats w/ pneumothorax resulting from medical care | children | pdi05 |
| 6 | % pediatric heart surgery patients who die | children | pdi06 |
| 7 | # pediatric heart surgical procedures (AHRQ defn.) | children | pdi07 |
| 8 | % pediatric surgeries w/ postoperative bleeding | children | pdi08 |
| 9 | % pediatric surgeries w/ postoperative respiratory failure | children | pdi09 |
| 10 | % pediatric surgeries w/ postoperative sepsis | children | pdi10 |
| 11 | % pediatric abdominal surgeries w/ postop wound dehiscence | children | pdi11 |
| 12 | % ped inpats with possible infection due to IV lines | children | pdi12 |
| 13 | % ped inpats with a blood transfusion reaction | children | pdi13 |
| 14 | % ped pats admitted with asthma | children | pdi14 |
| 15 | % ped pats admitted w/ diabetes short-term complications | children | pdi15 |
| 16 | % pediatric patients admitted with gastroenteritis | children | pdi16 |
| 17 | % pediatric patients admitted with perforated appendix | children | pdi17 |
| 18 | % pediatric patients admitted with urinary tract infections | children | pdi18 |
| Item # | Our Brief Description | Our Category | Our Code |
|---|---|---|---|
| 1 | % ped asthma pats.readmitted within 7 days of discharge | children | uasthm |
| 2 | % ped ED patients who return to ED within 48 hours | children | ured |
| 3 | % ped ED pats who return (48 hrs) and are hospitalized | children | uredad |
| Item # | Our Brief Description | Our Category | Our Code |
|---|---|---|---|
| 1 | % neonatal intensive care (NICU) mortality, risk adj. | Children - Neonatal ICU care | nicu1 |
| 2 | % neonatal intensive care (NICU) mortality, <=1000 gm | Children - Neonatal ICU care | nicu1a |
| 3 | % neonatal intensive care (NICU) mortality, 1001-1500 | Children - Neonatal ICU care | nicu1b |
| 4 | % neonatal intensive care (NICU) mortality, 1501-2500 | Children - Neonatal ICU care | nicu1c |
| 5 | % neonatal intensive care (NICU) mortality, 2501+ gms | Children - Neonatal ICU care | nicu1d |
| Item # | Our Brief Description | Our Category | Our Code |
|---|---|---|---|
| Press Ganey Overall Satisfaction | |||
| 1 | avg. overall satisfaction, inpatients | patient satisfaction | satin01 |
| 2 | avg. overall satisfaction, emergency department | patient satisfaction | sated01 |
| 3 | avg. overall satisfaction, outpatient surgery | patient satisfaction | satos01 |
| 4 | avg. overall satisfaction, outpatients | patient satisfaction | satot01 |
| Item # | Our Brief Description | Our Category | Our Code |
|---|---|---|---|
| 1 | % heart attack pats meeting all 8 applicable indicators | heart attack | amib1 |
| 2 | % heart failure pts meeting all 4 applicable indicators | heart failure | hfb1 |
| 3 | % pneumonia pats meeting all 8 applicable indicators | pneumonia | pnb1 |
| 4 | % surg pats meeting applic. infection prevention indics | surgery | scipb1 |
| Item # | Our Brief Description | Our Category | Our Code |
|---|---|---|---|
| 1 | % pneumonia ICU inpts blood cultures w/in 24 hr arrival | pneumonia | pn3a |
- Some indicators appear on more than one list.
- Area rates apply to geographic areas, not to hospitals.
- The Kentucky rates in our report are area rates.
Notes:
Quality Report Technical Notes
We use an objective statistical test. We apply the red and green coloring only if the difference from the national average is big enough to be “statistically significant” — and is not just random variation. We use standard statistical techniques to construct 99 percent confidence limits around our performance. If the national average is within the confidence interval, we consider our results “near the national average.” Otherwise, we color code our performance better (green) or worse (red) than the national average. In cases where the indicator does not have a predetermined high or low desired direction, we still color code statistically significant results, but we use blue and orange rather than red and green.
We use the same approach to color code the average Kentucky hospital red or green, with one twist. To avoid applying a noticeably more sensitive test to the Kentucky average than we apply to ourselves, we substitute Norton Healthcare’s number of cases in testing the Kentucky average. This approach means that Kentucky actually differs significantly from the national average on more indicators than those shown.
Because patient experience surveys can be based on very large samples, standard statistical tests can be too sensitive, color coding average performance as red or green. To avoid this problem, we have not allowed the sample size for significance testing to be larger than that required for 80 percent power. This refinement rarely changes the color coding, but it keeps the statistical test from labeling a 0.4 percent difference red or green.
In addition, color coding to red or green is based on the score being significantly different using the Wilson Score 99 percent confidence limits and must be outside the 25th to 75th percentile range based on the national distribution of scores.
Hospital A didn’t have as many cases as Hospital B.
Standard statistical techniques do not look just at how much a hospital’s performance differs from the nation’s. These techniques ensure that the difference isn’t just random variation. Statistical techniques become more sensitive (have more “power”) when they’re based on more cases. A hospital that has more cases is more likely to be shown in red or green than a hospital with fewer cases is.
Example: If the national complication rate for some indicator is 8 percent, a hospital with 50 cases and a 2 percent complication rate will be shown as average. Meanwhile, even though its complication rate is higher than 2%, a hospital with 500 cases and a 4 percent complication rate will be shown as better than average. Standard statistical techniques compare each hospital to the national average - not to another hospital - and the question they ask is, "Is this difference more than the luck of the draw?"
While situations such as that described in the question seem odd at first, they make sense. It may help to consider an extreme example.
Imagine a hospital that had only one case, a case that did not have a complication. Even though the hospital's complication rate is 0%, you probably aren't impressed that the hospital's rate is better than the national average of 8%. What if the hospital had two cases and no complications, is it truly better than the national average? You probably still think you have too few cases to make a judgment. The math behind the statistical comparison agrees with you, and it determines how many cases it takes ensure the results aren't just random variability. The more cases behind a statistic, the more likely the statistic is to be colored better than (green) or worse than (red) the national average.
Note: Patient experience results are not always compared with the same U.S. average. Norton Children’s Hospital is compared with a pediatric average for the inpatient and emergency department surveys.
Risk adjustment is a mathematical calculation that takes into account differences in patients and procedures. We use either the analysis provided by the national organization that supplies the comparative data, or — if that is unavailable — we use standardization by the indirect method, which is the usual approach.
Example: Imagine results like those shown in the table. The "All patients" row shows that the U.S. complication rate is 8 percent, while the hospital's complication rate is 16 percent - twice the national average.
| # with complication | # with Cases | Hospital's Complication % | U.S. Complication % | |
|---|---|---|---|---|
| Low-risk patients | 7 | 200 | 3.5 percent | 4 percent |
| High-Risk Patients | 73 | 300 | 24.3 percent | 25 percent |
| All Patients | 80 | 500 | 16 percent | 8 percent |
Now imagine classifying patients as high or low risk. For example, low-risk patients might be patients under age 75 who have no serious medical conditions, while high-risk patients would include everyone else. Looking at the table above, suppose that the hospital’s low-risk patients do slightly better than the national average (3.5 percent vs. 4 percent), and so do its high-risk patients (24.3 percent vs. 25 percent). The hospital’s overall complication rate is high because it sees a larger proportion of high-risk patients than the average U.S. hospital does. Instead of showing the hospital’s complication rate as twice as high as the national average, it should be shown as slightly better than the national average.
Calculation. Indirect standardization predicts what each hospital’s rate would be if it had the same complication rates as the nation has in each risk group. So, looking at the national percentages, we predict that 4 percent of the hospital's low-risk patients and 25 percent of its high-risk patients will have a complication. That means that the hospital's predicted number of complications for all patients is 4 percent of 200 + 25 percent of 300 = 8 + 75 = 83 complications. A standardized ratio may be calculated by dividing the hospital's actual number of complications by the predicted number, which is 80/83 = 0.964. The hospital does not actually have 100% of the complications it is predicted to have using national averages; it has only 96.4 percent of the national average. Multiplying the 0.964 ratio times the national rate of 8 percent., gives a risk-adjusted rate of 7.7 percent.
So, if we don't risk-adjust the hospital's rate, it has a complication rate equal to twice the national average. If we do risk-adjust the hospital's rate, we give it credit for its tougher cases. We say the hospital's risk-adjusted complication rate is 7.7 percent, compared to the U.S. rate of 8 percent -- which gives a much more accurate representation of the hospital's performance.
Norton Healthcare responds to lists of indicators and safe practices endorsed by national health care organizations. Click on an indicator to find the national organization endorsing the particular indicator. Table A gives the items on each national list and shows where each item is in our quality report. We show our data for the entire list of indicators. By being comprehensive, we can assure the public that we give a complete picture of our quality.
Here are the organizations and the lists included in this report. Click the links for background information on the organizations, as well as detailed definitions and supporting research for the indicators and safe practices. Note: Norton Healthcare is a member of NQF.
Note: Norton Healthcare is a member of NQF.
- Hospital care
- Cardiac surgery - also see - The Society for Thoracic Surgeons (STS)
- Nursing-sensitive care
- Ambulatory (physician office) care
- Safe practices
The Joint Commission and the Centers for Medicare and Medicaid Services (CMS)
- Indicators (these are included in the NQF Hospital Care indicators)
The Agency for Healthcare Research and Quality (AHRQ)
- Patient Safety Indicators (PSIs) and Inpatient Quality Indicators (IQIs)
Note: For consistency with other indicators in the Norton Healthcare Quality Report, we show the AHRQ indicators as percentages rather than as rates per 1,000.
Additional pediatric indicators come from The Joint Commission’s ORYX indicators, which we collect through:
The Joint Commission's ORYX indicators, which we collect through:
The BENCHmarking Effort for Networking Children's Hospitals (MMP)
- Asthma readmissions and returns to the Emergency Department
- Neonatal mortality by birth weight
AHRQ Patient Safety Indicators (PSIs) and Inpatient Quality Indicators (IQIs).
We display these statistics as percentages, not as rates per 1,000.
We use Kentucky Inpatient Outpatient Data Collection System (KY IPOP), excluding psychiatric and rehabilitation hospitals, and the most recent software programs available from The Agency for Healthcare Research and Quality (AHRQ) to calculate risk-adjusted (but not “smoothed”) rates for the hospital PSIs and IQIs. The PSIs and IQIs include indicators for geographic areas. We show a Kentucky average for all PSIs and IQIs, not just the ones that AHRQ defines as geographic area rates.
KY IPOP contains data for inpatients and outpatient surgery patients discharged from Kentucky hospitals. The data available to hospitals participating in KY IPOP include patient age (but not name or identifier), some diagnosis and procedure codes, diagnosis-related group (DRG), and admission and discharge dates. To ensure a direct comparison, whenever we use KY IPOP for the Kentucky average, we use KY IPOP for Norton Healthcare data, even though we have more diagnosis and procedure codes available about our patients.
As outlined by AHRQ, IQIs are adjusted with the most current version of APR-DRGs from 3M.
The Joint Commission/CMS data include several of the NQF hospital care indicators.
These data come from nurses reviewing paper and electronic medical records. After various audits and reliability checks, we enter the data into a computerized tool (QualityWorks) and send the results to national databases for edits and risk adjustment. We display data from The Joint Commission feedback reports, and we use The Joint Commission or CMS public sites to calculate the Kentucky median performance.
Additional cardiovascular procedure data.
Norton Audubon Hospital and Norton Hospital are participants in databases maintained by The Society for Thoracic Surgeons (STS) and American College of Cardiology (ACC). Nurses review medical records and enter the data into a computerized database. We then submit the data to STS & ACC. STS maintains the risk-adjustment models for these statistics.
Additional infection prevention data.
Infection control nurses review medical records according to National Nosocomial Infection Surveillance (NNIS) guidelines from the CDC (Centers for Disease Control and Prevention).
Nursing skill mix and hours per patient day.
We calculated these statistics using data from Norton Healthcare’s time and attendance and clinical information systems. As part of our work to provide high-quality nursing data, Norton Healthcare recently became a participant in the National Database of Nursing Quality Indicators (NDNQI).
Nursing work environment survey.
Using the nationally endorsed questionnaire, we surveyed a simple random sample of nurses at each hospital.
Nurse turnover rates.
Norton Healthcare Human Resources Department statistics were used to calculate turnover rates of nursing staff. The national comparative data are from the National Association of Healthcare Recruiters (NAHCR). The national data combine licensed practical nurses (LPNs) and unlicensed assistive personnel (UAPs) into a single number.
Patient falls and our use of restraints.
Nurses report patient falls and enter them into a computerized database.
Use of restraints is monitored in a one-day prevalence study, which is a count of the number of patients in restraints at a specific point in time. The survey is conducted at a randomly designated date and time within each quarter on all reporting units.
We submit our data on patient falls and restraints to the National Database of Nursing Quality Indicators. National comparison data on patient falls and restraints are a product of the American Nurses Association’s National Database of Nursing Quality Indicators (NDNQI)®.
Patients developing in-hospital pressure ulcers.
Data about patients developing in-hospital pressure ulcers are collected in a one-day prevalence study, which is a count of the number of patients with hospital-associated pressure ulcers at a specific point in time. “Hospital associated” refers to any pressure ulcer that is newly developed after admission to a facility. A team of qualified nurses performs the survey assessments. Individuals who will be conducting the clinical assessment must be trained and skilled in pressure ulcer identification and staging as well as have the ability to distinguish pressure wounds from other types of wounds. This information is submitted to the National Database of Nursing Quality Indicators (NDNQI®). National comparison data are a product of the American Nurses Association’s (NDNQI®).
Asthma readmissions and returns to the Emergency Department.
The displayed data are from feedback reports from the BENCHmarking Effort for Networking Children’s Hospitals (MMP).
Neonatal mortality by birth weight.
This is our calculation based on birth-weight category results from the Vermont-Oxford Network. The displayed U.S. average has been adjusted to Norton Women’s & Children’s Hospital and Norton Children’s Hospital’s mix of birth weights, and is not exactly equal to the U.S. average.
Patient experience.
Norton Healthcare uses Press Ganey Associates Inc., to conduct and analyze mail surveys of a statistically valid random sample of our patients. Because the questions and methods differ from one survey to the next, it is not valid to compare the results shown here to results from patient experience surveys other than those conducted by Press Ganey Associates Inc.
Norton Healthcare hospitals participate in HCAHPS (Hospital Consumer Assessment of Healthcare Providers and Systems). HCAHPS is a patient experience survey required by CMS for all hospitals in the United States. The survey is for adult inpatients, excluding psychiatric hospitals. Future data will allow for better patient experience comparisons across different hospitals.
Perhaps the most important limitation is that the nationally endorsed lists cover so little of what prospective patients might want to know about a hospital’s performance. Much more extensive information is needed to evaluate hospital care by specific procedures and conditions — rather than trying to capture hospital-wide complication rates, for example. Very few indicators address outpatient care or events that occur after the patient’s hospital stay. The current lists of indicators essentially do not take into account the patient’s long-term survival and condition.
- Current medical records codes do not capture important factors that should be used — but can’t be used — to adjust the statistics. For example, data used by these indicators do a poor job of distinguishing an infection the patient already had from an infection the patient developed in the hospital. The data do not distinguish an emergency case from one where more time was available to react. The data do not indicate if the patient had “do not resuscitate” orders, which would indicate that the patient’s death was expected and not a result of the care provided. Hospitals also differ in their documentation and coding practices.
- KY IPOP does not store all diagnosis and procedure codes. We are probably not risk-adjusting the PSIs and IQIs as much as they should be. This limitation may be trivial for some of the indicators, but may lead to greater inaccuracy for high-risk patients and procedures.
- The number of procedures performed is at best a proxy for other quality indicators. Some authorities suggest not using these volume-based indicators at all; others suggest using them only in conjunction with other indicators of quality of care.
- We cannot be certain about the comparability of the U.S. and Kentucky averages. The U.S. average may be based on a biased sample of states or hospitals. For example, the average for a particular indicator may be too high, because it is based only on hospitals that choose to submit their data to a national group. Presumably, the comparative average could also be too low, if — for example — states with high-risk or older populations are over-represented in the data.
- The only U.S. comparison available for our patient experience results is the average of the relevant Press Ganey database. Although more than 1,300 hospitals participate in Press Ganey surveys, those hospitals may not be representative of all hospitals in the U.S. In other words, we may be comparing ourselves to an average that is easier or tougher than it would be if it included every U.S. hospital. Also, patient experience results are not risk-adjusted, so they do not take into account different services that different hospitals provide. Patients who are in the hospital to deliver a baby may tend to rate their hospital experience differently from patients who are in the hospital because they had a heart attack. Patient experience averages do not take these expected differences into account.
- Data from one-day prevalence studies and limited staff questionnaires are subject to time-of-year and low-volume variability and may not accurately represent what more complete data would show.
- Although we follow national definitions, judgment calls must still be made about how to display data, how to classify data for some indicators, etc. We hope that this quality report helps contribute to the growing national and state interest in quantifying hospital quality performance and helps hasten the day when hospitals will have agreed-upon standard approaches to these decisions.
- We show a quality ribbon if a hospital has the best score possible.
Quality Report Disclaimer
In this quality report, the physician groups and hospitals of Norton Healthcare list their performance on more than 600 nationally recognized quality indicators and practices. Where available, performance of the average hospital in Kentucky and in the United States also is displayed.
The information in this report for each of our hospitals is the property of Norton Healthcare and may not be reproduced or distributed in any manner without the express written permission of Norton Healthcare.
While we have attempted to ensure the accuracy of the data that we report for each of our hospitals, we make no representations or warranties, expressed or implied, as to the accuracy or completeness of the information reported. Likewise, we make no representations or warranties, expressed or implied, as to the accuracy of the comparative data for hospitals in Kentucky and the nation. We assume no legal liability or responsibility for any errors or omissions in the information or for any loss or damage resulting from the use of any information contained in this quality report.
This report is not intended to provide medical advice or to offer any guarantee regarding the services we provide our patients. Deciding on treatment options and choosing a hospital are decisions you should make by talking with your physician. You should not attempt to choose a hospital based solely on statistics and descriptions such as those given in our quality report.
Links to other sites are not endorsements by Norton Healthcare of any site, and we do not have any control over or responsibility for the content of these sites.
References to other organizations do not imply an endorsement by those organizations of our services or analyses.